---
title: "A $51.5 Billion NDIS Should Show What Outcomes It Delivers"
description: "Participants report some gains. But public reporting still cannot show which supports produced them—or what outcomes the Scheme's $51.5 billion annual spend is delivering."
date: "2026-06-10"
date-modified: "2026-10-20"
categories: [ndis, outcomes, disability, australia]
author: "Aydin"
---
```{r}
#| label: setup
#| include: false
library(readr)
library(dplyr)
library(tidyr)
library(ggplot2)
library(stringr)
library(forcats)
library(scales)
library(knitr)
source(file.path("..", "..", "R", "data_sources.R"))
theme_set(
theme_minimal(base_size = 12) +
theme(
plot.title.position = "plot",
plot.caption.position = "plot",
panel.grid.minor = element_blank()
)
)
raw_dir <- "data-raw"
source_registry <- read_source_registry("sources.csv")
source_files <- lapply(
seq_len(nrow(source_registry)),
function(index) download_registered_source(source_registry[index, , drop = FALSE], raw_dir)
)
source_manifest <- write_source_manifest(source_files, file.path(raw_dir, "source-manifest.csv"))
source_path <- function(source_id) {
index <- match(source_id, source_registry$source_id)
if (is.na(index)) stop("Missing source in sources.csv: ", source_id, call. = FALSE)
source_files[[index]]$path
}
clean_names <- function(x) {
x |>
str_to_lower() |>
str_replace_all("&", "and") |>
str_replace_all("[^a-z0-9]+", "_") |>
str_replace_all("^_|_$", "")
}
assert_true <- function(condition, message) {
if (!isTRUE(condition)) stop(message, call. = FALSE)
}
cohort_label <- function(x) {
case_when(
x == "Participant 0 to before school" ~ "Early childhood",
x == "Participant starting school to 14" ~ "School age",
x == "Participant 15 to 24" ~ "Young people",
x == "Participant 25 and over" ~ "Adults",
TRUE ~ x
)
}
direction_lookup <- bind_rows(
tibble(
cohort = "Early childhood",
indicator_number = 1:5,
direction_class = c("Adverse", rep("Favourable", 4))
),
tibble(
cohort = "School age",
indicator_number = 1:8,
direction_class = rep("Favourable", 8)
),
tibble(
cohort = "Young people",
indicator_number = 1:14,
direction_class = c(
rep("Favourable", 4), "Ambiguous", "Adverse", rep("Favourable", 8)
)
),
tibble(
cohort = "Adults",
indicator_number = 1:15,
direction_class = c(
rep("Favourable", 3), "Ambiguous", "Adverse",
rep("Favourable", 7), "Adverse", rep("Favourable", 2)
)
)
)
assert_true(
nrow(direction_lookup) == 42 && !anyDuplicated(direction_lookup[c("cohort", "indicator_number")]),
"The explicit outcome-direction lookup is incomplete or duplicated."
)
short_outcome <- function(x) {
text <- str_to_lower(x)
case_when(
str_detect(text, "able to tell them") ~ "Can communicate what they want",
str_detect(text, "make friends with people outside") ~ "Can make friends outside family",
str_detect(text, "concerns in 6 or more") ~ "Fewer broad development concerns",
str_detect(text, "becoming more independent") ~ "Becoming more independent",
str_detect(text, "happy with the level of independence/control") ~ "Happy with independence and control",
str_detect(text, "paid job") ~ "Has a paid job",
str_detect(text, "volunteer") ~ "Volunteers",
str_detect(text, "participate in education") ~ "Education or training",
str_detect(text, "unable to do a course") ~ "Able to do wanted course or training",
str_detect(text, "actively involved in a community") ~ "Active in a community group",
str_detect(text, "did not have any difficulties accessing health") ~ "No difficulty accessing health care",
str_detect(text, "rate their health as good") ~ "Good or better health",
str_detect(text, "choose what they do each day") ~ "Chooses daily activities",
str_detect(text, "choose who supports") ~ "Chooses who supports them",
str_detect(text, "happy with their home") ~ "Happy with home",
str_detect(text, "safe or very safe") ~ "Feels safe at home",
str_detect(text, "mainstream class") ~ "Mainstream class attendance",
str_detect(text, "genuine say in decisions") ~ "Has a say in decisions",
str_detect(text, "want more choice and control") ~ "Wants more choice and control",
str_detect(text, "no friends other than") ~ "Has friends beyond family or paid staff",
str_detect(text, "welcomed or actively include") ~ "Welcomed or included",
TRUE ~ str_remove(x, "^% ") |> str_trunc(52)
)
}
baseline_raw <- read_csv(
source_path("ndis_baseline_outcomes_2026_06"),
show_col_types = FALSE,
na = c("", "NA", "na")
)
longitudinal_raw <- read_csv(
source_path("ndis_longitudinal_outcomes_2026_06"),
show_col_types = FALSE,
na = c("", "NA", "na")
)
names(baseline_raw) <- clean_names(names(baseline_raw))
names(longitudinal_raw) <- clean_names(names(longitudinal_raw))
baseline_required <- c(
"rprtdt", "statecd", "questionnaire", "indicator_number",
"indicator_description", "percentage"
)
longitudinal_required <- c(
"rprtdt", "statecd", "number_of_sf_reassessments", "questionnaire",
"indicator_number", "indicator_description", "percentage_t0", "percentage_t1"
)
assert_true(all(baseline_required %in% names(baseline_raw)), "The baseline outcomes schema has changed.")
assert_true(all(longitudinal_required %in% names(longitudinal_raw)), "The longitudinal outcomes schema has changed.")
baseline <- baseline_raw |>
filter(statecd == "ALL", str_starts(questionnaire, "Participant")) |>
transmute(
report_date = as.Date(rprtdt, "%d-%m-%Y"),
cohort = cohort_label(questionnaire),
indicator_number = as.integer(indicator_number),
outcome = indicator_description,
baseline_rate = as.numeric(percentage)
)
reassessment_all <- longitudinal_raw |>
filter(
statecd == "ALL",
str_starts(questionnaire, "Participant"),
number_of_sf_reassessments == 1
) |>
transmute(
report_date = as.Date(rprtdt, "%d/%m/%Y"),
cohort = cohort_label(questionnaire),
indicator_number = as.integer(indicator_number),
outcome = indicator_description,
baseline_rate = parse_number(as.character(percentage_t0), na = c("", "NA", "na")),
reassessment_rate = parse_number(as.character(percentage_t1), na = c("", "NA", "na"))
) |>
filter(is.finite(baseline_rate), is.finite(reassessment_rate)) |>
mutate(
outcome_short = short_outcome(outcome)
)
unmapped_directions <- reassessment_all |>
anti_join(direction_lookup, by = c("cohort", "indicator_number"))
unused_directions <- direction_lookup |>
anti_join(reassessment_all, by = c("cohort", "indicator_number"))
assert_true(
nrow(unmapped_directions) == 0 && nrow(unused_directions) == 0,
"The participant outcome keys do not match the explicit direction lookup."
)
reassessment_all <- reassessment_all |>
left_join(direction_lookup, by = c("cohort", "indicator_number")) |>
mutate(
direction = case_match(
direction_class,
"Favourable" ~ 1,
"Adverse" ~ -1,
"Ambiguous" ~ NA_real_
),
raw_change = reassessment_rate - baseline_rate,
adjusted_change = raw_change * direction
)
reassessment_one <- reassessment_all |>
filter(is.finite(direction))
expected_cohorts <- c("Early childhood", "School age", "Young people", "Adults")
assert_true(identical(sort(unique(baseline$cohort)), sort(expected_cohorts)), "Unexpected participant cohorts in baseline outcomes.")
assert_true(identical(sort(unique(reassessment_one$cohort)), sort(expected_cohorts)), "Unexpected participant cohorts in longitudinal outcomes.")
assert_true(nrow(baseline) == 42, "Expected 42 national participant baseline outcomes.")
assert_true(nrow(reassessment_all) == 42, "Expected 42 national participant outcomes at first reassessment.")
assert_true(
!anyDuplicated(baseline[c("cohort", "indicator_number", "outcome")]),
"Baseline outcome keys are not unique."
)
assert_true(
!anyDuplicated(reassessment_all[c("cohort", "indicator_number", "outcome")]),
"Longitudinal outcome keys are not unique."
)
assert_true(!anyDuplicated(baseline[c("cohort", "indicator_number")]), "Baseline cohort and indicator-number keys are not unique.")
assert_true(!anyDuplicated(reassessment_all[c("cohort", "indicator_number")]), "Longitudinal cohort and indicator-number keys are not unique.")
baseline_keys <- baseline |>
transmute(key = str_c(cohort, indicator_number, sep = "::")) |>
pull(key) |>
sort()
reassessment_keys <- reassessment_all |>
transmute(key = str_c(cohort, indicator_number, sep = "::")) |>
pull(key) |>
sort()
assert_true(identical(baseline_keys, reassessment_keys), "Baseline and longitudinal cohort/indicator keys do not match.")
assert_true(sum(str_detect(str_to_lower(reassessment_all$outcome), "concerns in 6 or more")) == 1, "The development-concerns indicator changed.")
assert_true(sum(str_detect(str_to_lower(reassessment_all$outcome), "unable to do a course")) == 1, "The training-access indicator changed.")
assert_true(sum(str_detect(str_to_lower(reassessment_all$outcome), "no friends other than")) == 2, "The no-friends indicators changed.")
assert_true(sum(str_detect(str_to_lower(reassessment_all$outcome), "want more choice and control")) == 2, "The ambiguous choice indicators changed.")
assert_true(nrow(reassessment_one) == 40, "Expected 40 direction-classified outcomes at first reassessment.")
assert_true(all(baseline$report_date == as.Date("2026-06-30")), "Baseline outcomes are not current to 30 June 2026.")
assert_true(all(reassessment_one$report_date == as.Date("2026-06-30")), "Longitudinal outcomes are not current to 30 June 2026.")
assert_true(all(between(baseline$baseline_rate, 0, 1)), "Baseline percentages fall outside 0 to 1.")
assert_true(all(between(reassessment_one$baseline_rate, 0, 1)), "Longitudinal baseline percentages fall outside 0 to 1.")
assert_true(all(between(reassessment_one$reassessment_rate, 0, 1)), "Reassessment percentages fall outside 0 to 1.")
cohort_summary <- reassessment_one |>
group_by(cohort) |>
summarise(
outcomes = n(),
median_change = median(adjusted_change),
improved = sum(adjusted_change > 0),
unchanged = sum(adjusted_change == 0),
worsened = sum(adjusted_change < 0),
.groups = "drop"
) |>
mutate(cohort = factor(cohort, levels = expected_cohorts)) |>
arrange(cohort)
early_childhood_summary <- cohort_summary |> filter(cohort == "Early childhood")
adult_summary <- cohort_summary |> filter(cohort == "Adults")
largest_gain <- reassessment_one |> slice_max(adjusted_change, n = 1, with_ties = FALSE)
largest_two_gains <- reassessment_one |>
slice_max(adjusted_change, n = 2, with_ties = FALSE) |>
arrange(desc(adjusted_change))
largest_fall <- reassessment_one |> slice_min(adjusted_change, n = 1, with_ties = FALSE)
evidence_sources <- read_csv("evidence-sources.csv", show_col_types = FALSE)
assert_true(nrow(evidence_sources) == 7, "The broader NDIS evidence register is incomplete.")
assert_true(!anyDuplicated(evidence_sources$source_id), "The broader NDIS evidence register has duplicate IDs.")
```
::: {.callout-note title="Executive summary"}
- The NDIS made **$51.5 billion in nominal cash-basis payments** in the 12 months to June 2026. Spending is traceable by category; outcomes are not linked to the supports and dollars behind them.
- This is not a claim that there are no benefits. Participants report improvement in some areas, and independent studies find credible gains in selected domains.
- The accountability gap is that public evidence still cannot reliably show **which funded supports work, for whom, and whether the outcomes are commensurate with the spend**.
:::
The NDIS can tell the public—in considerable detail—how many participants it supports and how much it pays. In the 12 months to June 2026, nominal cash-basis payments reached $51.5 billion, as set out in the [companion analysis of NDIS payments and utilisation](../ndis-budget-utilisation-prediction/). For a program of that scale, the reasonable question is: **where is the equally clear public evidence of the outcomes that spending delivers?**
The answer is not “there are no measured outcomes”. The NDIA's [2024 Participant Outcomes Summary Report](https://dataresearch.ndis.gov.au/media/4191/download) examined 296 indicators and found 30% with statistically significant and material change, separating favourable from adverse movements. Some participants report meaningful improvement and several independent analyses find credible scheme-level benefits.
The problem is traceability. Public outcome reporting rarely lets us connect a particular therapy, support worker, assistive technology purchase or other funded support—and the money spent on it—to a better outcome. The freshest downloadable extract also publishes rounded aggregates without the denominators and uncertainty needed to judge the precision of individual movements.
The cohort consists of matched respondents whose latest Short Form assessment was their first reassessment, generally around one year after first-plan approval. The data can show where reported outcomes moved; it cannot establish that the NDIS caused the movement.
## We can see some change, but not what the spending produced
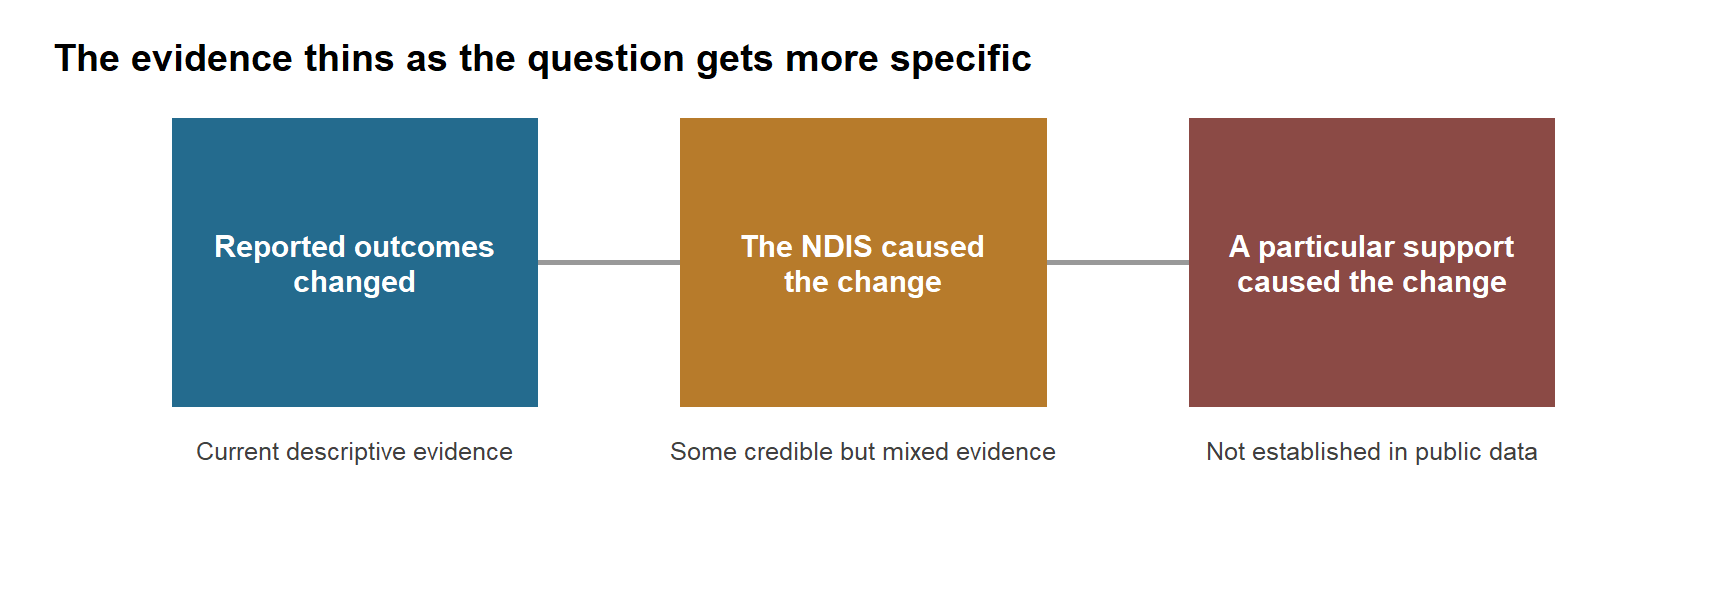
The argument becomes clearer when it is split into three questions:
1. **Did reported outcomes change after people entered the Scheme?** Yes, for some measures and cohorts. This is the strongest and most current public evidence.
2. **Did the NDIS cause those changes?** There is some credible scheme-level evidence, but it is mixed across outcomes and methods.
3. **Which supports caused better outcomes for which participants—and at what cost?** The public evidence is not yet reliable enough to answer this.
```{r}
#| label: evidence-ladder
#| fig-cap: "Public evidence is strongest for reported change, mixed for scheme-level attribution and weakest for intervention-level effectiveness."
#| fig-alt: "Three connected boxes show that evidence becomes less conclusive as the question narrows from whether reported outcomes changed, to whether the NDIS caused the change, to whether a particular support caused the change."
#| fig-width: 9
#| fig-height: 3.1
evidence_ladder <- tibble(
  x = 1:3,
  question = c(
    "Reported outcomes\nchanged",
    "The NDIS caused\nthe change",
    "A particular support\ncaused the change"
  ),
  assessment = c(
    "Current descriptive evidence",
    "Some credible but mixed evidence",
    "Not established in public data"
  ),
  fill = c("#246b8e", "#b77b2b", "#8b4a45")
)

ggplot(evidence_ladder, aes(x, 1)) +
  annotate("segment", x = 1.36, xend = 1.64, y = 1, yend = 1, colour = "grey60", linewidth = 1) +
  annotate("segment", x = 2.36, xend = 2.64, y = 1, yend = 1, colour = "grey60", linewidth = 1) +
  geom_tile(aes(fill = fill), width = 0.72, height = 0.8, show.legend = FALSE) +
  geom_text(aes(label = question), colour = "white", fontface = "bold", lineheight = 0.95, size = 4) +
  geom_text(aes(y = 0.48, label = assessment), colour = "grey25", size = 3.3) +
  scale_fill_identity() +
  coord_cartesian(xlim = c(0.55, 3.45), ylim = c(0.25, 1.45), clip = "off") +
  labs(title = "The evidence thins as the question gets more specific") +
  theme_void(base_size = 12) +
  theme(plot.title = element_text(face = "bold"), plot.margin = margin(10, 20, 15, 20))
```
The broader evidence base supports that middle position. The [independent trial evaluation](https://acdhs.edu.au/wp-content/uploads/2018/05/NDIS-Evaluation-Final-Report.pdf) found that the Scheme delivered intended outcomes overall, including improved choice and control and generally modest participant-wellbeing gains, but that benefits were uneven. It found no statistically detectable effect on overall child wellbeing—a broader measure that does not negate the reported communication and friendship movements below, but does stop us treating them as causal evidence of a child-level benefit. Taylor Fry's [modelling for the NDIS Review](https://www.ndisreview.gov.au/sites/default/files/2023-11/Taylor_Fry_NDIS%20Review_Cost_Benefit_Analysis.pdf) found positive results for some participant outcomes—including life satisfaction, choice and control, housing, transport and hospital use—but not self-rated health, safety or school outcomes. Its separate HILDA analysis found improved participant financial security and stronger carer results, but no significant participant improvement in life satisfaction, employment, income, school outcomes or psychological distress.
A [2025 quasi-experimental staggered-rollout study](https://journals.plos.org/plosone/article?id=10.1371/journal.pone.0321377) provides a useful counterweight: its difference-in-differences design found no statistically significant short-run area-level effects on formal-service use, caring hours, carer employment or social participation. The causal interpretation depends on the design's identifying assumptions; the study also had limited statistical power and measured local NDIS availability rather than confirmed individual receipt. It is a null result—not proof of no benefit.
Taken together, the evidence says that benefits are plausible and sometimes visible, but not universal. It is much stronger at identifying broad change than at showing what the Scheme's spending produced.
## The newest public data shows most first-reassessment changes are small
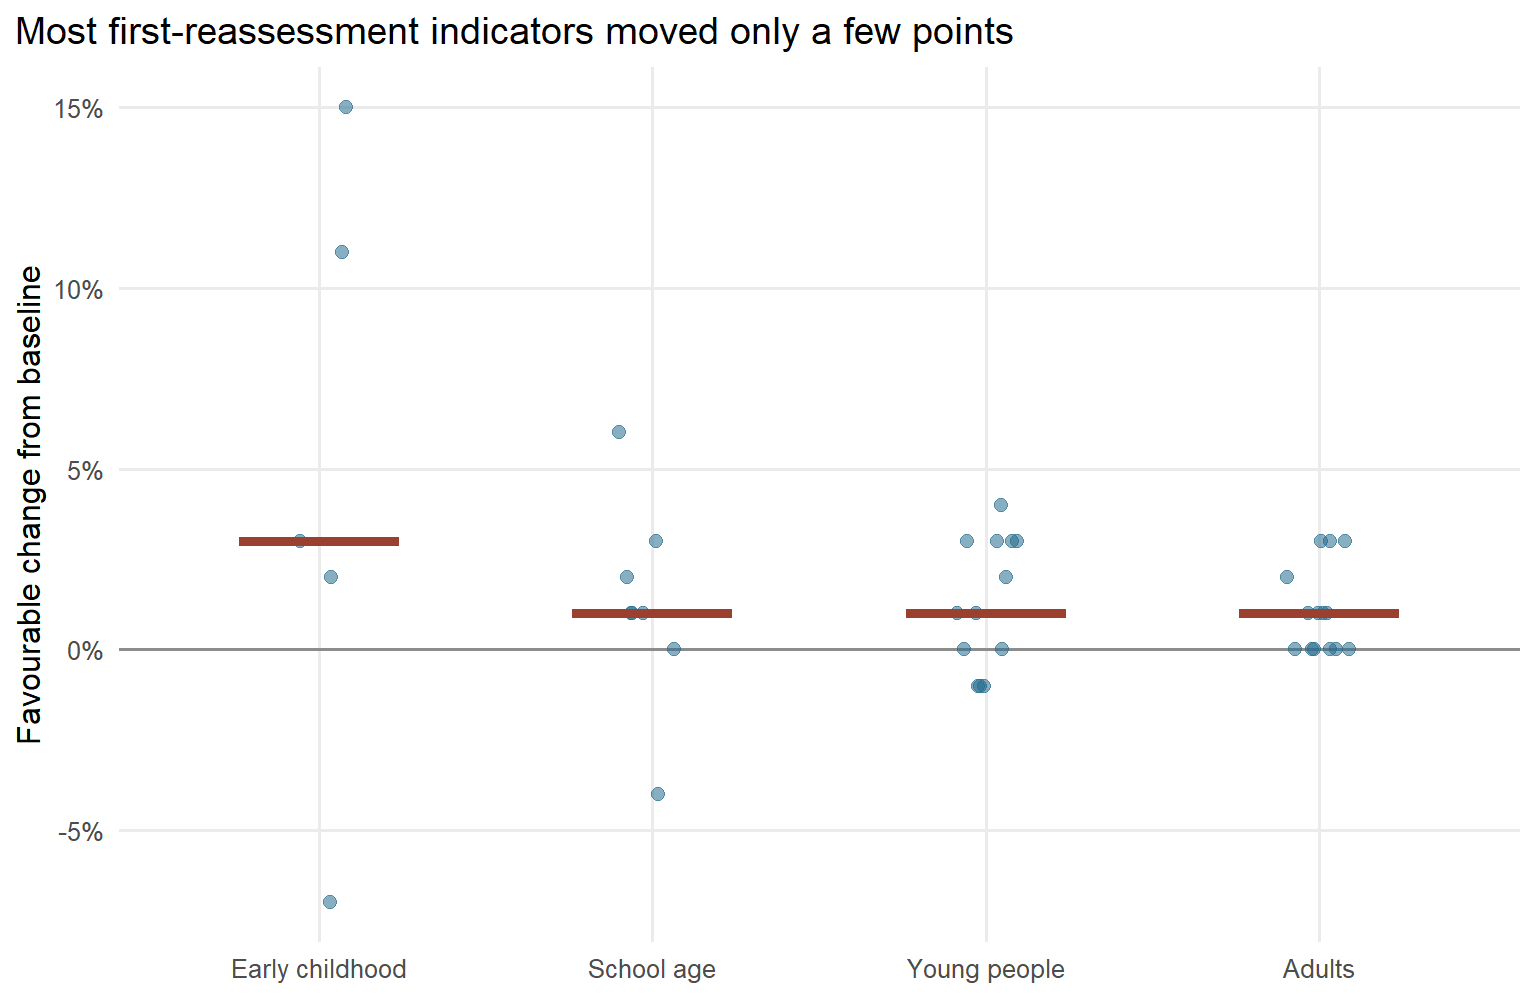
For each outcome, I compare the baseline percentage with the first reassessment percentage for the group recorded as having one reassessment. Three indicators are coded adverse on their face—broad development concerns, inability to access wanted training, and having no friends beyond family or paid staff—and reversed so that positive means favourable movement. For development concerns, improved recognition may contribute to the movement, so its interpretation remains uncertain. The two “want more choice and control” indicators are excluded because their direction is ambiguous: wanting more choice can reveal unmet need, greater agency, or both.
Across the 40 direction-classified participant indicators, most movements cluster close to zero. Early childhood has `r early_childhood_summary$improved` of `r early_childhood_summary$outcomes` indicators moving favourably, but it also contains the largest movement coded adverse on its face. Among adult indicators, `r adult_summary$improved` improve, `r adult_summary$unchanged` are unchanged and none worsen at the published one-percentage-point precision. The red medians summarise heterogeneous indicators; they are not participant medians and should not be used to rank cohorts.
```{r}
#| label: reassessment-distribution
#| fig-cap: "Direction-adjusted change from baseline to first reassessment. Each point is one published outcome; positive values indicate favourable movement. Red bars are medians across indicators, not participant-level effects."
#| fig-alt: "Dot plot of 40 direction-classified outcome changes by age cohort. Most cluster between zero and three percentage points. Early childhood contains the two largest favourable movements and the largest movement coded adverse on its face."
#| fig-width: 8
#| fig-height: 5.2
plot_reassessment <- reassessment_one |>
  mutate(cohort = factor(cohort, levels = expected_cohorts))

ggplot(plot_reassessment, aes(cohort, adjusted_change)) +
  geom_hline(yintercept = 0, colour = "grey55", linewidth = 0.6) +
  geom_jitter(width = 0.10, height = 0, alpha = 0.55, size = 2.2, colour = "#246b8e", seed = 2026) +
  stat_summary(fun = median, geom = "crossbar", width = 0.48, linewidth = 0.7, colour = "#9b3f2f") +
  scale_y_continuous(labels = label_percent(accuracy = 1), breaks = seq(-0.05, 0.15, 0.05)) +
  labs(title = "Most first-reassessment indicators moved only a few points", x = NULL, y = "Favourable change from baseline")
```
## The largest reported movements are concentrated
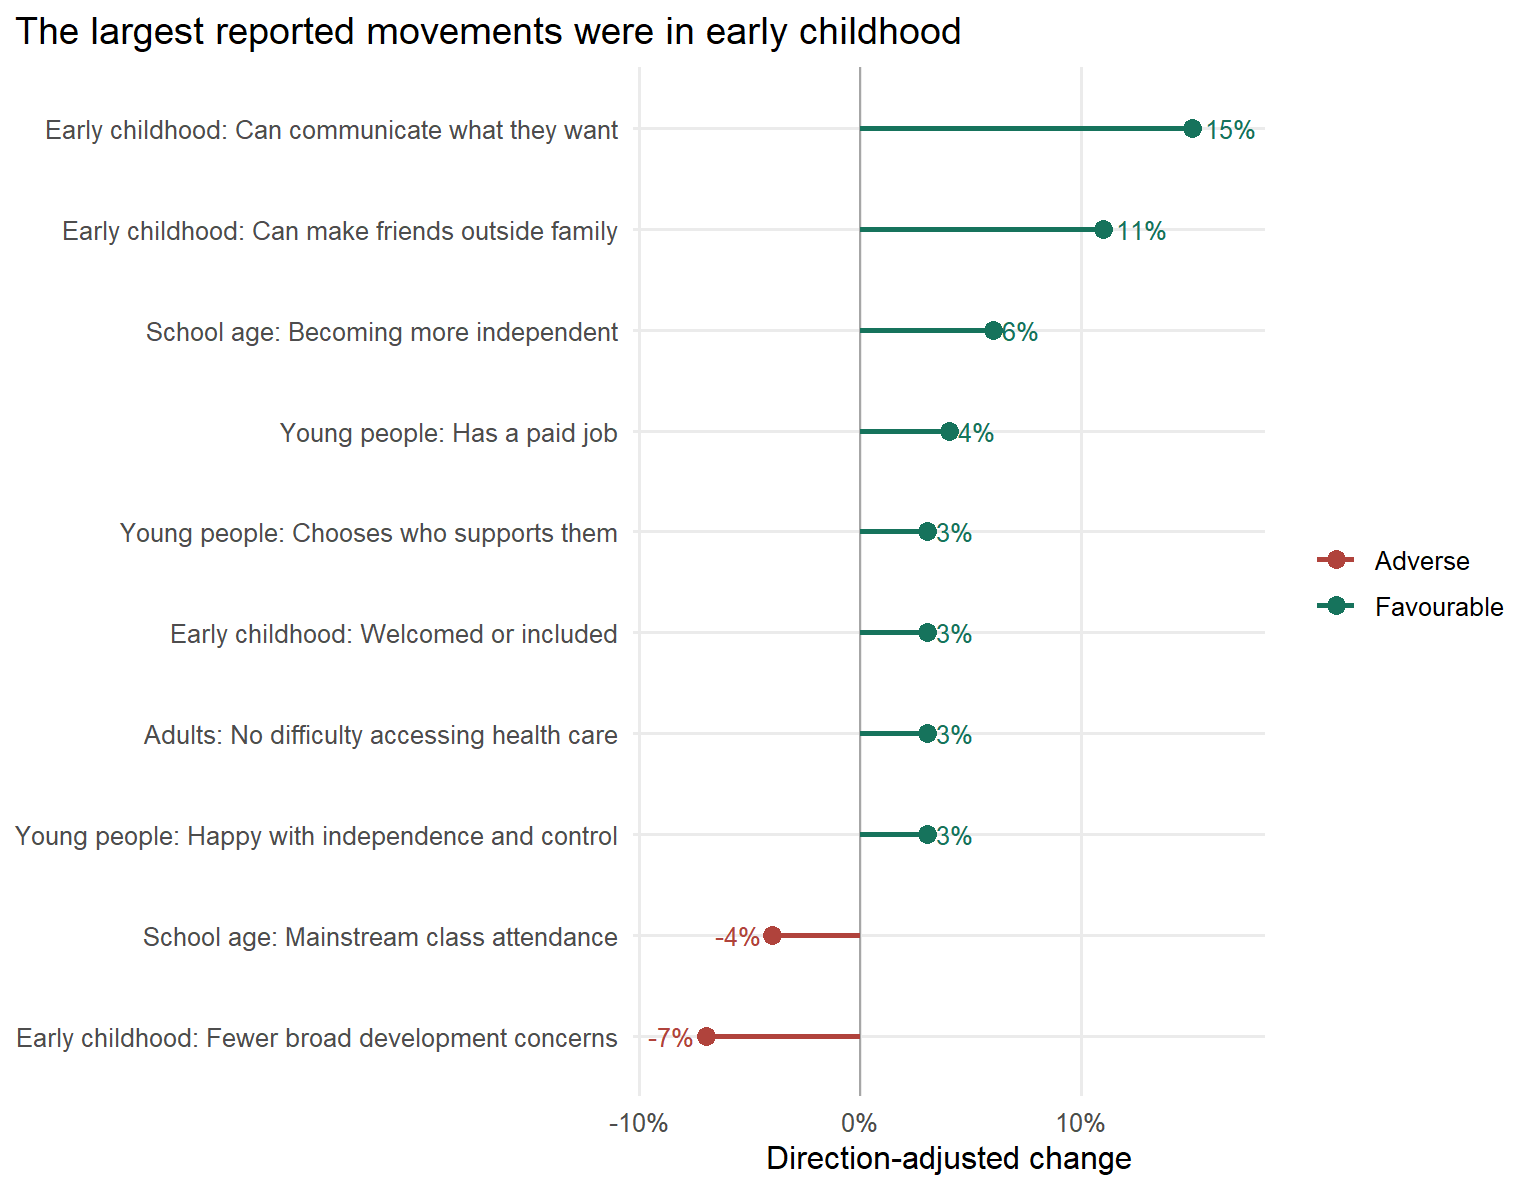
The largest favourable change is `r largest_gain$outcome_short` for `r str_to_lower(largest_gain$cohort)`, up `r number(100 * largest_gain$adjusted_change, accuracy = 1)` percentage points. The largest movement coded adverse on its face is `r largest_fall$outcome_short` for `r str_to_lower(largest_fall$cohort)`, down `r number(100 * abs(largest_fall$adjusted_change), accuracy = 1)` percentage points after accounting for direction. The NDIA's 2024 report notes that greater use of specialist services can also reflect improved recognition of developmental concerns, so that indicator's interpretation is uncertain.
The chart makes the concentration visible: the two double-digit favourable movements both relate to children before school age. Adult employment, education and volunteering do not show comparable movement in the first-reassessment cohort.
```{r}
#| label: largest-movements
#| fig-cap: "A descriptive selection of the ten largest rounded absolute movements from baseline to first reassessment. Positive values indicate favourable movement. The source provides no sample counts or uncertainty estimates, so this is not a statistical ranking."
#| fig-alt: "Diverging dot chart of the ten largest reported outcome movements. Communication and friendships among young children have the largest favourable movements. Broad development concerns have the largest face-value adverse movement, although better recognition may affect that measure."
#| fig-width: 8
#| fig-height: 6.2
largest_movements <- reassessment_one |>
  slice_max(abs(adjusted_change), n = 10, with_ties = FALSE) |>
  mutate(
    label = str_c(cohort, ": ", outcome_short),
    label = fct_reorder(label, adjusted_change),
    direction_label = if_else(adjusted_change >= 0, "Favourable", "Adverse")
  )

ggplot(largest_movements, aes(adjusted_change, label, colour = direction_label)) +
  geom_vline(xintercept = 0, colour = "grey65") +
  geom_segment(aes(x = 0, xend = adjusted_change, yend = label), linewidth = 0.9) +
  geom_point(size = 3) +
  geom_text(
    aes(label = percent(adjusted_change, accuracy = 1)),
    hjust = if_else(largest_movements$adjusted_change >= 0, -0.25, 1.25),
    show.legend = FALSE,
    size = 3.4
  ) +
  scale_x_continuous(labels = percent, limits = c(-0.09, 0.17)) +
  scale_colour_manual(values = c(Favourable = "#16735c", Adverse = "#b0433c")) +
  labs(title = "The largest reported movements were in early childhood", x = "Direction-adjusted change", y = NULL, colour = NULL)
```
## Entry outcomes provide context, not a current scorecard
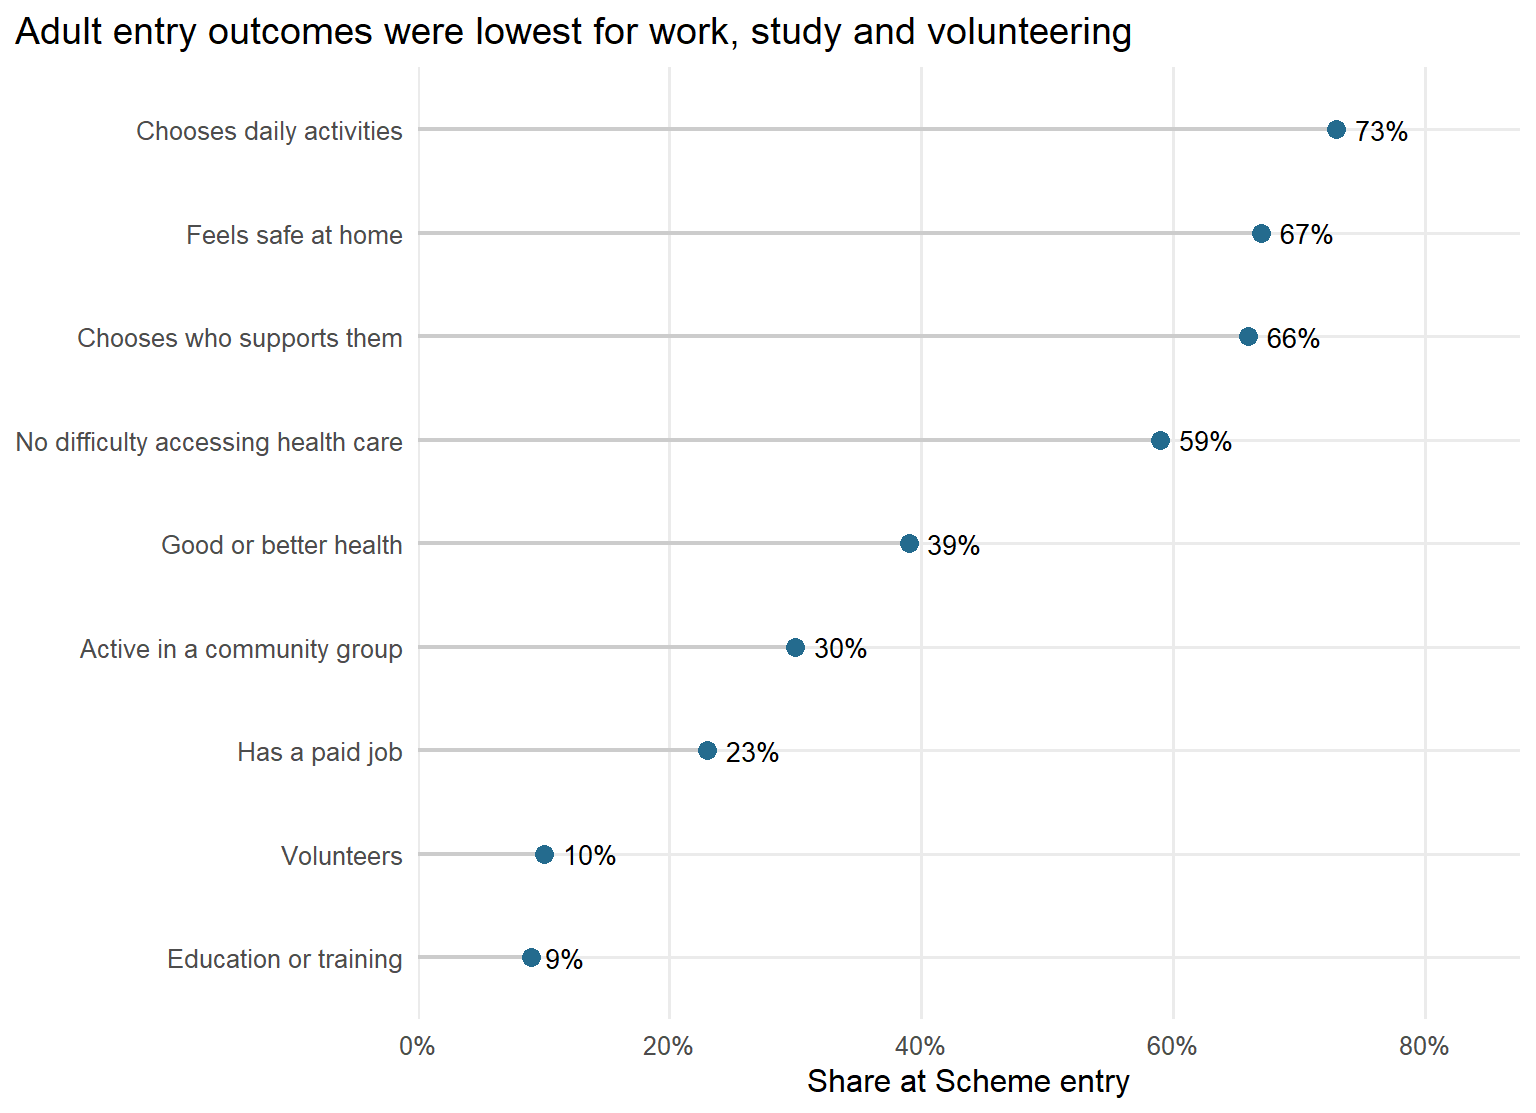
The baseline file is often tempting to describe as “current outcomes”. It is not. It records outcomes **when participants entered the Scheme**, for people represented in the June 2026 extract. It is a starting-point profile.
Among adults, the entry picture separates relatively common measures of home and day-to-day choice from much lower economic and community participation. Only 23% had a paid job, 10% volunteered and 9% participated in education, training or skill development at baseline.
```{r}
#| label: adult-baseline
#| fig-cap: "Selected outcomes for adults at NDIS entry, in the data current to 30 June 2026. These are baseline—not current—levels."
#| fig-alt: "Dot chart of nine adult outcomes at NDIS entry. Choosing daily activities, choosing supports, and feeling safe at home are relatively common, while paid work, volunteering, and education or training are below one quarter."
#| fig-width: 8
#| fig-height: 5.8
adult_baseline_patterns <- c(
  "choose what they do each day",
  "choose who supports them",
  "feel safe or very safe",
  "did not have any difficulties accessing health services",
  "rate their health as good",
  "actively involved in a community",
  "have a paid job",
  "participate in education, training",
  "volunteer"
)

adult_baseline <- baseline |>
  filter(cohort == "Adults") |>
  filter(str_detect(str_to_lower(outcome), str_c(adult_baseline_patterns, collapse = "|"))) |>
  mutate(
    outcome_short = short_outcome(outcome),
    outcome_short = fct_reorder(outcome_short, baseline_rate)
  )

assert_true(nrow(adult_baseline) == length(adult_baseline_patterns), "The selected adult baseline outcomes changed.")

ggplot(adult_baseline, aes(baseline_rate, outcome_short)) +
  geom_segment(aes(x = 0, xend = baseline_rate, yend = outcome_short), colour = "grey80", linewidth = 0.8) +
  geom_point(size = 3, colour = "#246b8e") +
  geom_text(aes(label = percent(baseline_rate, accuracy = 1)), hjust = -0.35, size = 3.5) +
  scale_x_continuous(labels = percent, limits = c(0, 0.85), expand = expansion(mult = c(0, 0.03))) +
  labs(title = "Adult entry outcomes were lowest for work, study and volunteering", x = "Share at Scheme entry", y = NULL)
```
## The missing public account is spend to support to outcome
These published movements are useful monitoring signals, not participant-level effect estimates. They are not uniformly large and they are not spread evenly across ages or domains. The largest reported favourable movements are in early-childhood communication and friendship or social connection. Broad development concerns move adversely on their face, although better recognition may be part of that movement. For adults, the indicators tied to work, learning and community participation remain low at entry and generally change little in the first-reassessment cohort.
The [Independent NDIS Review](https://www.ndisreview.gov.au/sites/default/files/resource/download/working-together-ndis-review-final-report.pdf) reached the same deeper problem: the Outcomes Framework was not fit for purpose and it was difficult to link supports, investment and outputs to participant outcomes. Taylor Fry also warned that observational spending models can mistake participant need, goals or declining function for the effect of a support. More spending can correlate with a worse outcome because people with greater needs receive more support; an employment-support payment can correlate with employment because the person already had an employment goal.
So the core conclusion is not that the NDIS fails. It is that Australia spends and reports tens of billions of dollars without yet having a reliable public learning system that tells participants, providers and governments what outcomes that spending produced.
## What a real learning system would need
- participant-level links between the support received, its intensity and timing, and later outcomes;
- published sample sizes and uncertainty, with comparable outcomes defined before analysis;
- credible comparison groups or phased evaluations where practical and ethical;
- results split by disability, age, geography and starting need so average effects do not hide who benefits; and
- participant-defined outcomes and cost-effectiveness, not spending or plan utilisation alone.
## Three-line takeaway
- NDIS payments are traceable by category; public outcomes are not linked to the supports and dollars behind them.
- This does not mean there are no benefits: participants report some gains and independent studies find credible improvements in selected domains.
- The unresolved public-accountability question is which supports produced which outcomes, for whom, and whether those outcomes justify the spend.
## Appendix {#appendix}
::: {.callout-note collapse="true" title="Cohort definition, caveats and method"}
The first-reassessment comparison describes matched respondents whose latest Short Form assessment was their first reassessment, generally around one year after first-plan approval. It is not a representative panel of all NDIS participants and has no untreated counterfactual.
Four limits shape the interpretation:
- The extract has no participant-level records or sample counts, so uncertainty cannot be calculated.
- Common questions can be linked across age-based Short Form questionnaires, but a question introduced only in an older-age form receives a new baseline. The observations underpinning individual indicators can therefore differ.
- Percentages are rounded to whole percentage points. A reported zero change may conceal a smaller movement.
- The direction-adjusted charts combine heterogeneous indicators. Their red medians are medians across published indicators, not people, and the top-ten chart is a descriptive selection of rounded extremes rather than a statistical ranking.
For direction coding, three indicators are coded adverse on their face—broad development concerns, inability to access wanted training, and having no friends beyond family or paid staff—and reversed so positive means favourable movement. Improved recognition may contribute to the development-concerns movement, so that indicator's interpretation remains uncertain. The two “want more choice and control” indicators are excluded because their direction is ambiguous.
:::
::: {.callout-note collapse="true" title="Broader evidence and spending-source audit"}
The broader sources answer different questions and therefore should not be treated as interchangeable estimates. The Flinders comparison-group evaluation and Taylor Fry models are the most informative here for scheme-level attribution. The NDIS Review is an expert synthesis diagnosing the measurement gap rather than an estimate of the Scheme's effect. The latest NDIA extract is strongest for current descriptive monitoring, while the staggered-rollout study is a quasi-experimental causal-inference design estimating narrow area-level carer and service-use effects.
```{r}
#| label: broader-evidence-audit
evidence_sources |>
  transmute(
    Source = str_c("[", title, "](", source_url, ")"),
    Year = publication_year,
    Design = study_design,
    `What it supports` = what_it_supports,
    `Key limit` = key_limit
  ) |>
  kable(align = c("l", "r", "l", "l", "l"), escape = FALSE)
```
The evidence is consistent with benefits for some participants. It is not sufficient to rank individual supports or providers by effectiveness.
:::
::: {.callout-note collapse="true" title="Direction-coding audit for all indicators"}
```{r}
#| label: direction-coding-audit
reassessment_all |>
  arrange(factor(cohort, levels = expected_cohorts), indicator_number) |>
  transmute(
    Cohort = cohort,
    Indicator = indicator_number,
    Outcome = outcome,
    Baseline = percent(baseline_rate, accuracy = 1),
    Reassessment = percent(reassessment_rate, accuracy = 1),
    `Raw change` = paste0(number(100 * raw_change, accuracy = 1), " pp"),
    `Assigned direction` = if_else(direction_class == "Ambiguous", "Ambiguous—excluded", direction_class),
    `Direction-adjusted change` = if_else(
      is.na(adjusted_change),
      "Excluded",
      paste0(number(100 * adjusted_change, accuracy = 1), " pp")
    )
  ) |>
  kable(align = c("l", "r", "l", "r", "r", "r", "l", "r"))
```
The two “want more choice and control” indicators are the ambiguous rows excluded from the direction-adjusted charts.
:::
::: {.callout-note collapse="true" title="Sources and reproducibility"}
The analysis uses the NDIA's [baseline and longitudinal participant outcomes datasets](https://dataresearch.ndis.gov.au/datasets/participant-datasets) and their data-rules documents, all current to 30 June 2026. The source files are pinned by size and SHA-256 checksum in `sources.csv`; set `BLOG_REFRESH_DATA=true` to force a fresh download and checksum validation. In the registry, `release_date` records the downloadable asset's Last-Modified date.
```{r}
#| label: source-manifest
source_manifest |>
  transmute(
    source = dataset,
    source_revision_date = release_date,
    coverage_end,
    file = local_file,
    bytes = comma(bytes),
    sha256_prefix = substr(sha256, 1, 12)
  ) |>
  kable(col.names = c("Source", "Source/revision date", "Coverage end", "Cached file", "Bytes", "SHA-256 prefix"))
```
:::